We all would like to improve on our open rates. How are we supposed to generate lead lists from our content if no one is opening and viewing our content? There is a simple way to get more eye balls on your content and it hasn’t been a secret for a long time. Adding visuals to your content marketing can help not only improve your open rate; but it can also improve your bounce rate, time on page, and shares. All of those metrics are important to your content marketing strategy.
>> Related: The Impact of a Great Webinar Program <<
When creating content marketing keep in mind how you can incorporate visuals seamlessly. The four visuals that I have found to be effective are infographics, gifs, charts, and videos. The human mind processes information much faster when looking at a graphic rather than reading it from a page. Having a graphic rather than text on a page makes your content more appealing to the eye as well, thus promoting a reader to share or at the least spend more time on the page. Would you rather read an essay or browse through an infographic? Yeah, that is what I thought. Stop pushing bland content! Let’s add some seasoning to your content and give it that kick it needs!
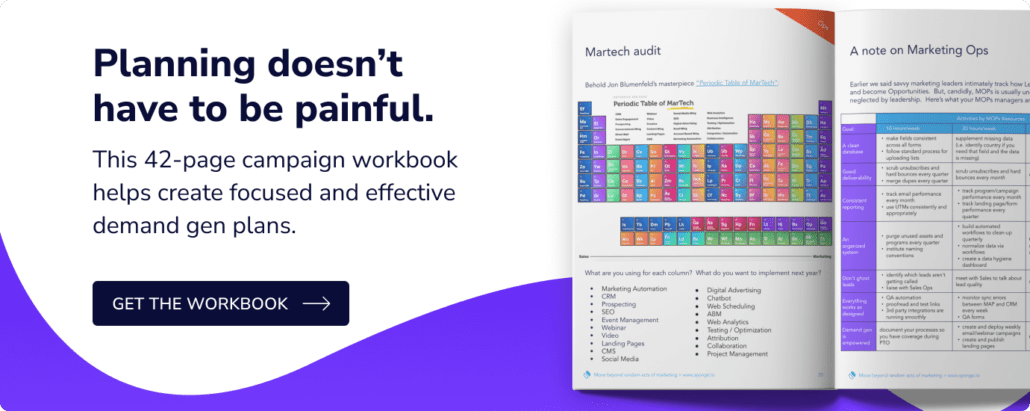
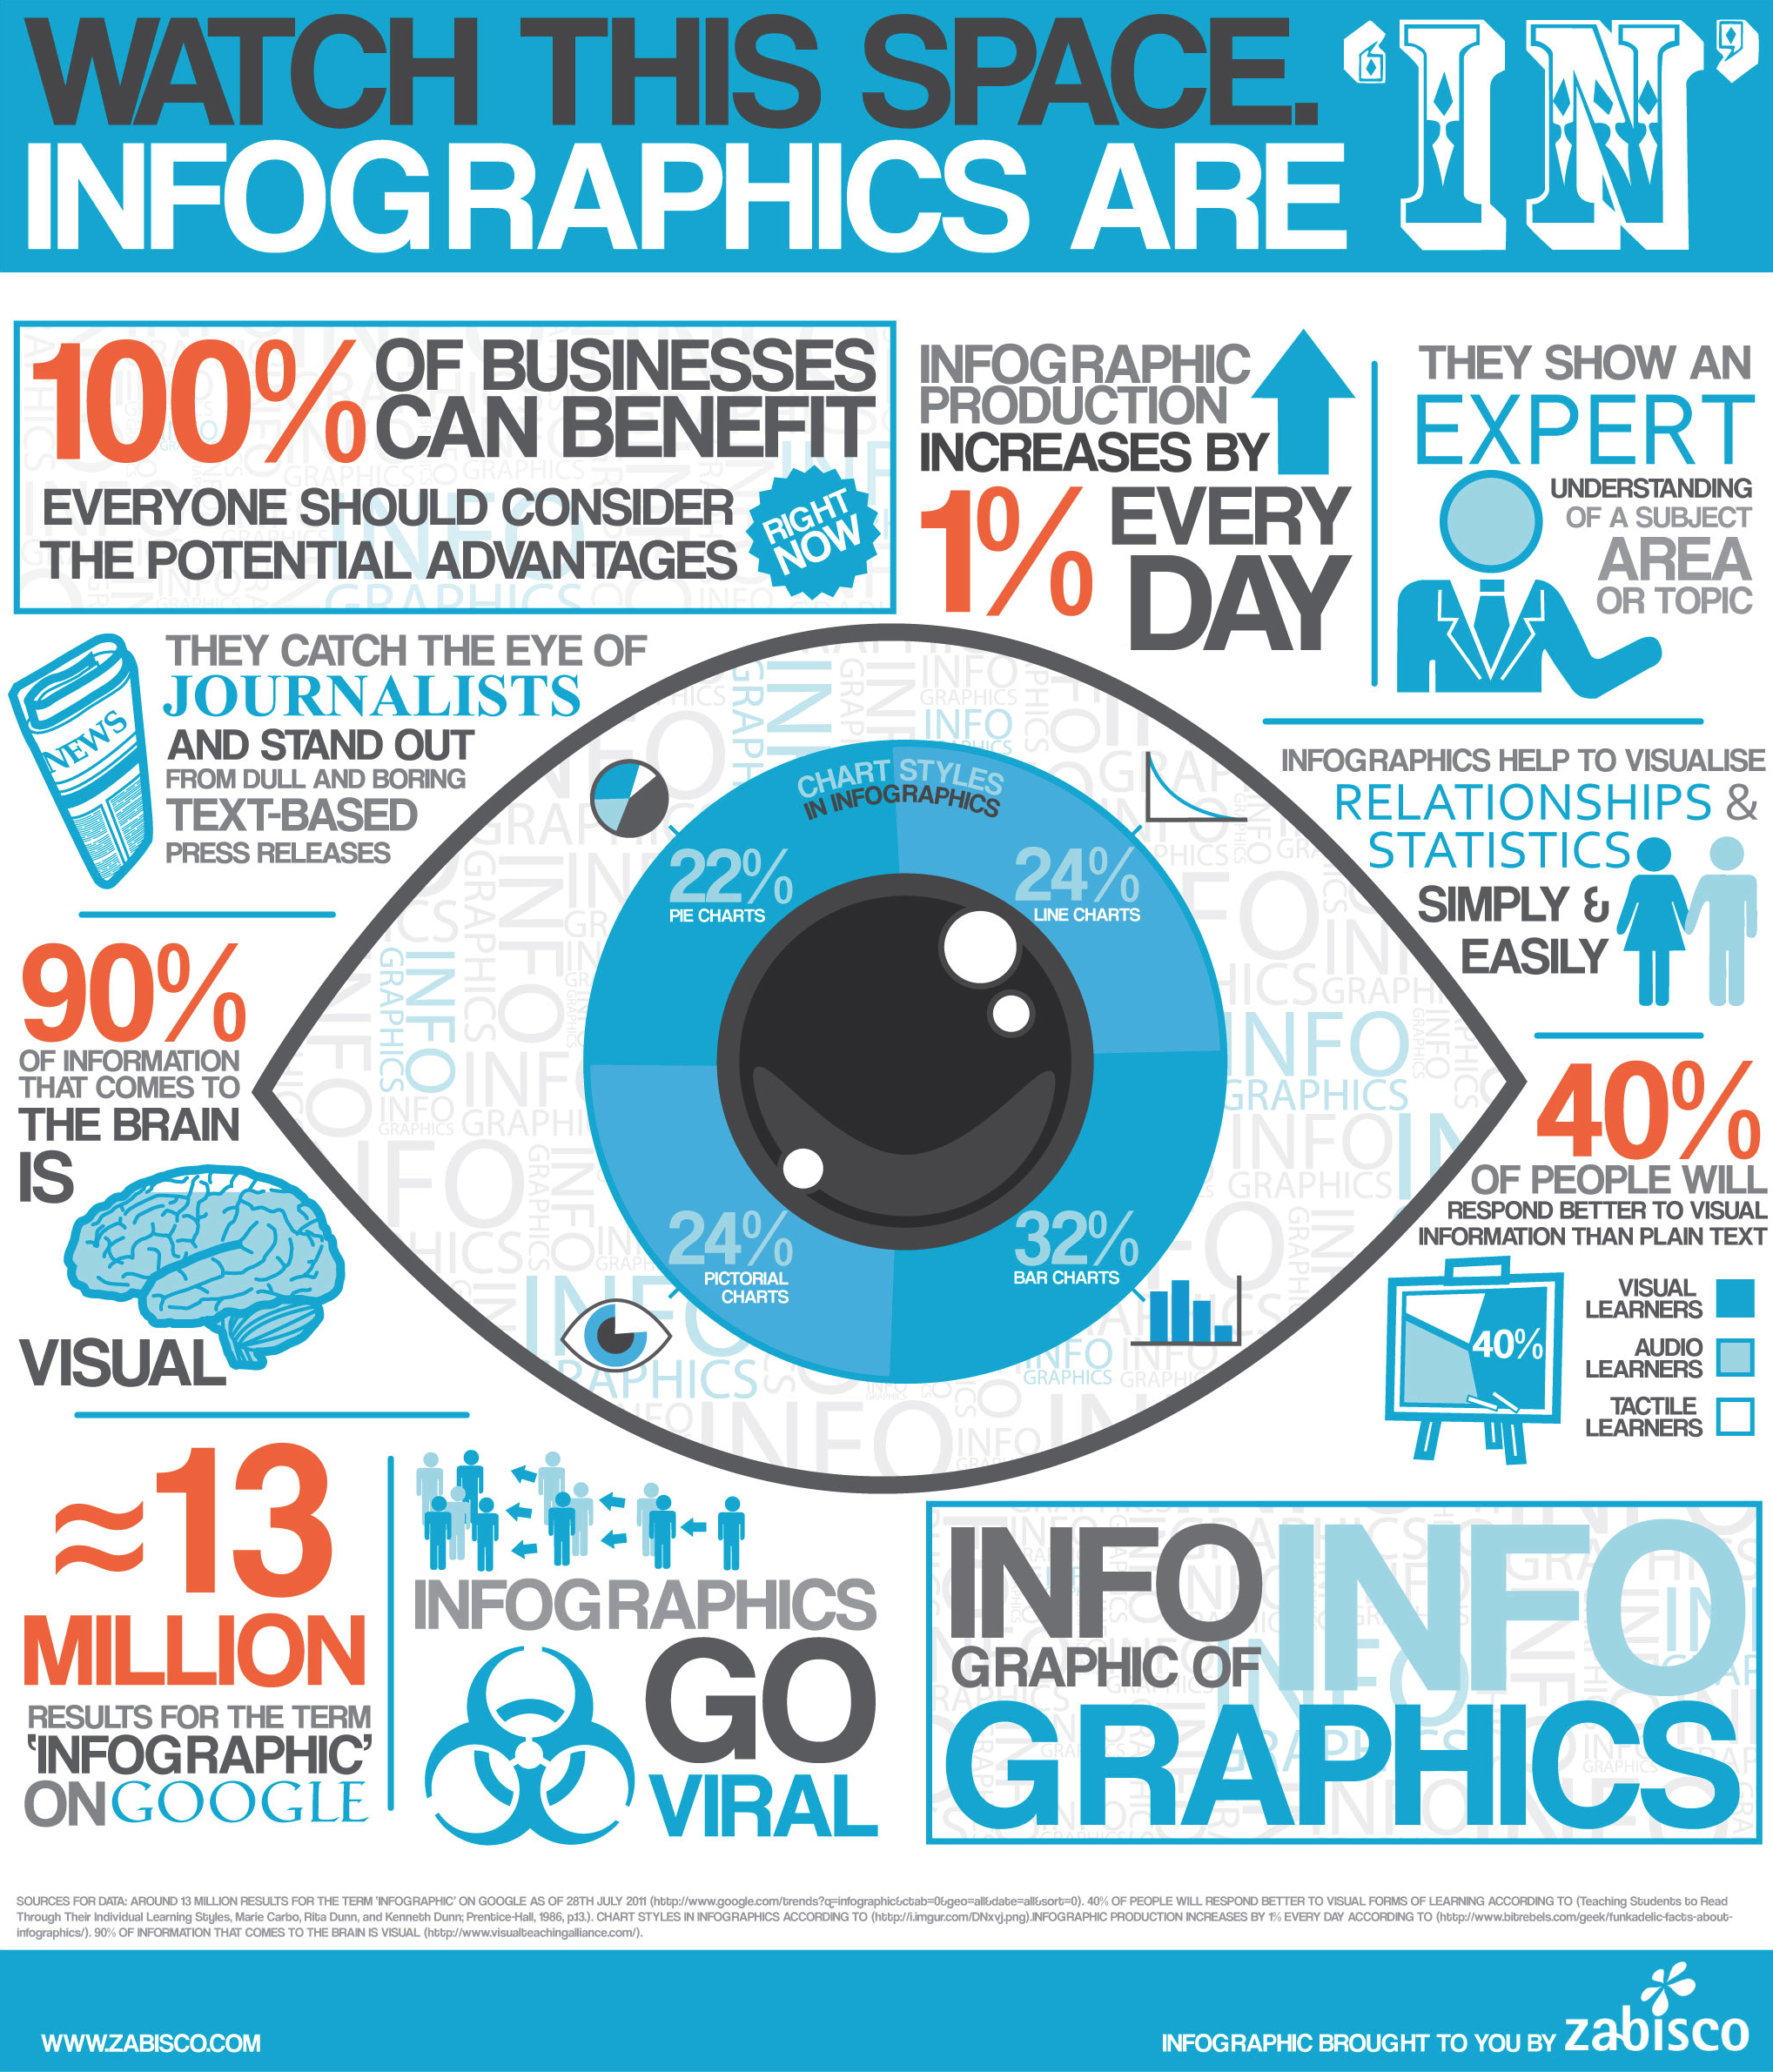
1) Infographic
Unless you have been living under a rock for the past five years, odds are you’ve heard of, or seen, an infographic. An infographic is a great way to supply readers with a large amount of data quickly and in an appealing way. Infographics are useful for more than just presenting information, they also do a great job at showing trends as opposed to an excel sheet. If you are looking to create an infographic I would suggest using Venngage. Venngage is a free infographic maker that I’ve used before with great success. It is much like Canva in that you can simply “drag and drop” items onto the page to create your infographic.
2) Gif
Gif stands for graphic interchange format. That sounds a lot fancier than it really is, as a gif really just an extension for a document much like .csv or .pdf. Having said that gif’s are a great way to stop and grab a viewer’s attention. Instead of a still image, a gif places stim images one after another in a repeating loop. This action is aimed at grabbing a viewer’s attention and getting them to stop and look.
3) Charts/Graphs
It is important to display information in an appealing way. The way in which you present information can lead to a better understanding. As mentioned with infographics, charts and graphs can help viewers have a better understanding of what the numbers are trying to say than if you were to present them in writing or an excel sheet. It is a lot easier to see a correlation between two numbers when they are presented in a chart then if you are shifting through an excel sheet with many different variables on it. When making a chart or graph keep make sure you are not presenting too much information so that the eye can get lost. Include only the essential information. Also, it is important to keep in mind a color scheme that fits with the graphic and flows easily throughout. This is generally done by combining warm and cool colors (back to our high school art classes) to the graphic to make it aesthetically pleasing.
4) Video
Video is already a big part of modern marketing and it will only continue to grow. Video allows for copious amounts of information to be consumed in a relatively quick timeframe. Rather than reading a 100-page book; you might be able to consume that information in about 15 minutes. The way the human mind works is that it can process images and sound much faster than it can process words from a page. If you have a piece of content marketing such as an e-book, or long form blog, consider making it into a webinar or demo on the overall topic. This can take the overbearing feeling out of people who might fear that your 100-page e-book is not worth reading.
Top 10 Ways to Make a Great Video (watchmojo.com)
I am a strong believer that you can take good content and make it great. One of the best ways to do this is by attaching visuals to it. Doing more to enhance the experience of your viewers is always a good idea. Yes, it is going to take more time to create your content, but if you are already creating content why not make it great and get the most out of it by adding visuals to it? Don’t waste your time and effort by making boring content marketing that doesn’t keep a reader’s attention, spice it up with some visuals!
Header image via Giphy