As marketers, we all want to answer these questions with confidence:
- “How much pipeline was driven by that trade show? By events overall?”
- “Do we get anything useful from webinars?”
- “How many total dollars did Marketing source versus Sales and Partners?”
- “What’s the ROI of this campaign? Should we do it again?”
> Related: Lead Source vs. Lead Source Detail vs. Campaign Source <<
But a marketer’s dilemma is the more sophisticated our tactics, the murkier our understanding of what’s driving pipeline. Is it the LinkedIn ad? Blog post? Demo video? Nurture email? SDR call? Case study? Yikes. In practice, most of us are hacking it together in Excel. Which, if we’re honest, is kinda the same as ¯\_(ツ)_/¯
This is why we crave marketing attribution reports. Attribution is understanding which tactics move pipeline forward. It sounds complicated and expensive, but it’s doesn’t have to be.
No doubt marketing tech is getting overwhelming, and it’s pretty miserable trying to track Leads and Opps across Facebook, WordPress, Lead Pages, HubSpot, Salesloft, and Salesforce (and that’s a pretty simple tech stack).
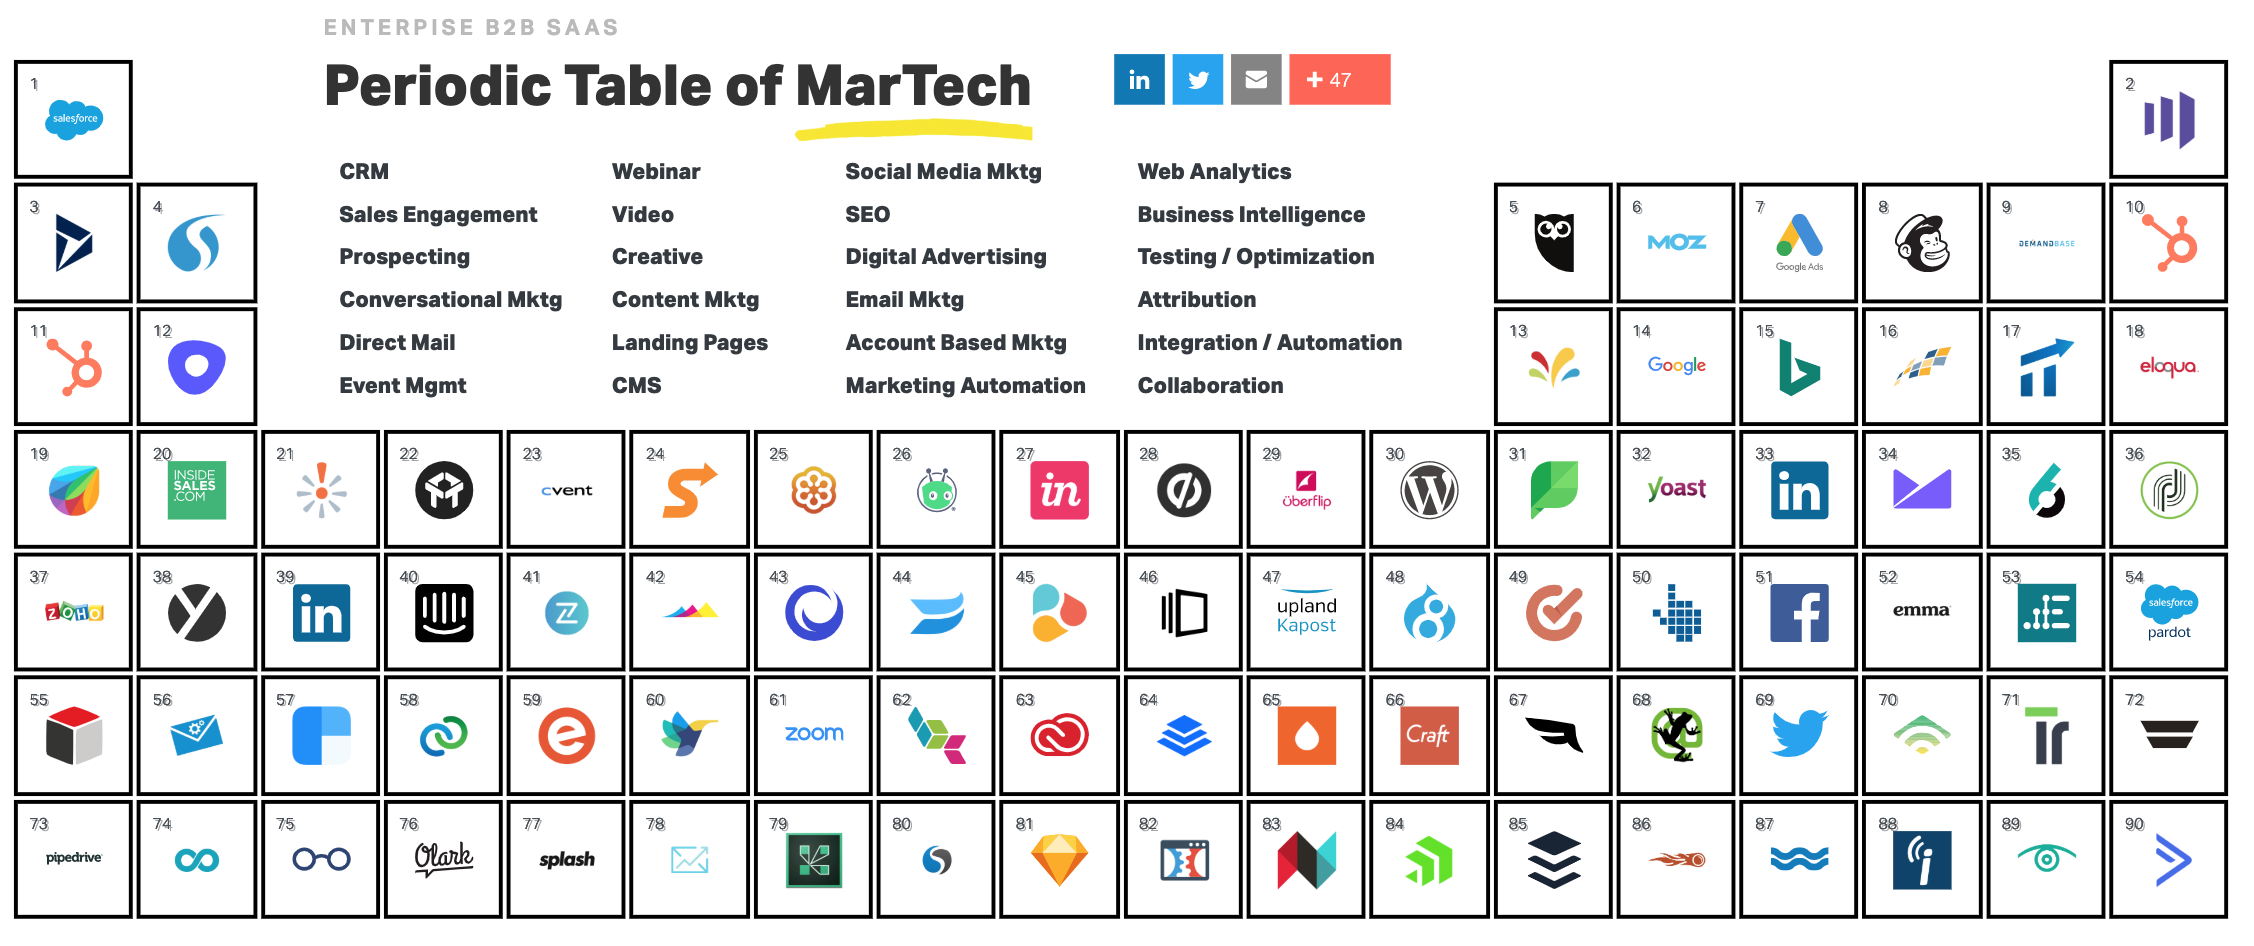
BTW this Periodic Table of Martech by Jon Blumenfeld is a damn delight!
But the inconvenient truth about attribution? It’s a [simple] discipline. No attribution tool, or genius developer, or algorithm, or $$$$ is going to “solve” attribution for you. (sorry attribution software vendors) You just have to consistently do the work.
The great news? That work isn’t a herculean lift. You’re probably two weeks away from better insights.
All in? These are the 4 steps to choose and implement a marketing attribution model.
In this post:
Video walkthrough
Step 1: What reports do you crave?
Yes, begin at the end. There are a lot of ways to attribute pipeline:
- Content asset – specific content titles
- Content type – videos, blogs, case studies, reports, ebooks
- Channel/Medium – website, organic social, paid social, email
- Campaign – Gartner Magic quadrant, product launch
- Lead source – a list buy, a tradeshow, inbound
Envision your perfect dashboard… the one that’s going to change which campaigns you run and how you invest your budget. Which 5 questions are the most important to answer? Personally, we come back to these insights over and over, but you know your business (and your Sales leadership) best.
- Funnel History by Month: how many MQLs were created last month?
- Current Funnel Inventory by Stage: how many people are currently in MQL stage?
- Funnel Conversion Report: how many / how quickly did MQLs convert to other stages?
- Campaign Performance Report: how many MQLs came directly from that tradeshow?
- Campaign Influence Report: how many opps were influenced by that tradeshow?
Step 2: Create the data you need for attribution
You feed the attribution model with a specific kind of data. Yes, we’re talking about UTM codes.
I think most marketers profoundly underestimate UTMs. Writing/inserting UTM codes is usually a chore relegated to junior marketers. Training is breezy. Naive managers don’t fully understand the value (I know because I was one).
So, hard question time: Whose job is it to create and use UTMs? Do they know what they’re doing? Does their boss?
FWIW, this is a great explainer to train someone, and this is our handy UTM template.
Step 3: Pick an attribution model
One of tensest debates across Marketing, Sales, and LDR teams is about the model itself. After all, everyone wants credit for their contributions. But models are just lenses into the underlying data… they each have small distortions. We usually recommend using these two:
- Use a Last Touch report to track the last campaign response before becoming an MQL.
- Use a Multi Touch by Influence report to show how, over time, a certain campaign accrues a lot (or a little) influence.
So yes, go ahead and pick a couple suitable models by asking: Which touches led to a recent closed/won deal? Which model would reveal those insights? But don’t let the project languish, awaiting consensus – as your business evolves, you can change up your attribution model to answer new questions.
Step 4: Actually implement the marketing attribution model
You’re using UTM parameters every time, everywhere! Google Analytics is collecting the data! You’ve decided how you’ll model influence! Now what?
Depending on your Marketing Ops resources, you’ll use the UTM data to implement a marketing attribution model one of three ways:
- Good: events/goals in Google Analytics
- Better: unique campaigns in Salesforce
- Best: custom attribution (Full Circle Insights/Bizible)
You’re still here?

Time to go have some honest conversations:
- Why do we want attribution? Will it change our behavior? Is it worth constant maintenance?
- Which 5 questions are the most important to answer?
- Whose job is it to create and use UTMs? Do they know what they’re doing? When will they start using them?
- Which touches led to a recent closed/won deal? Which model would reveal those insights?
- Do we have the talent to manage and interpret the findings? Will we get ROI?
- Are we reviewing the insights? Are we making different/better decisions? (+90 Days)
Ready to take attribution to the next level in Marketo? Read the third post in this series: How to Capture URL Parameters in Marketo with Cookies >


