Preparing marketing performance slides for the Board is a high-blood-pressure task each quarter. I (fondly?) recall a CEO calling me after a dozen rounds of edits, and instructing me in exasperation to “put everything in a box.” She was right, of course. Time is tight in the meetings. Slides have to speak for themselves. And every data point is an invitation for deeper scrutiny. I embraced “the box”, and here are some of the most successful marketing board slides I’ve seen since.
>> Related: 5 Reports to Measure Funnel Performance in Salesforce <<
In this post:
1. Complex projects
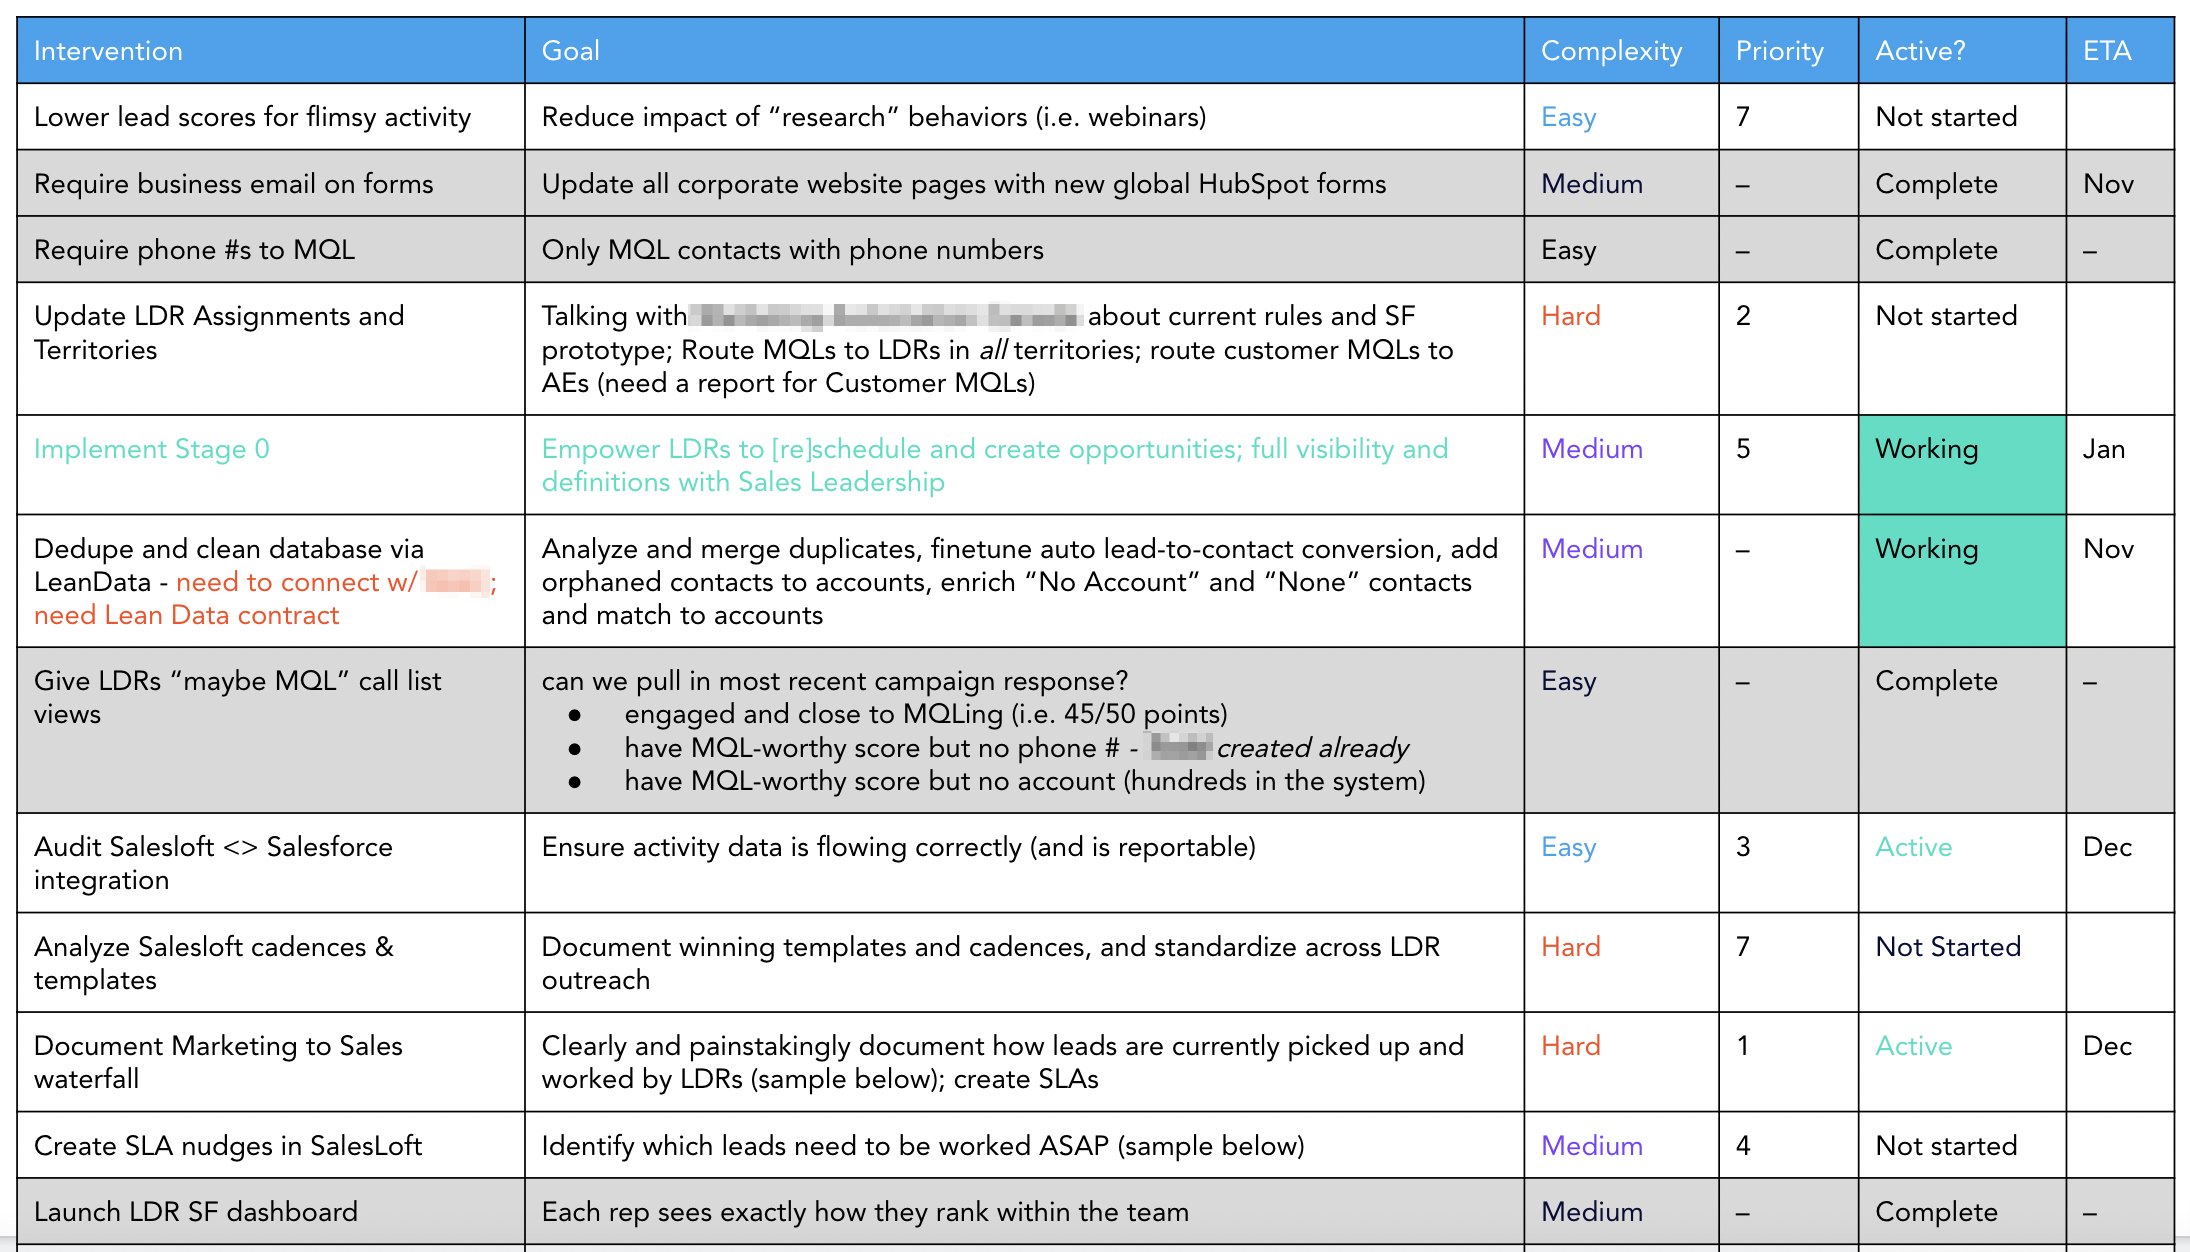
It’s not easy presenting complicated projects that weave together multiple teams, milestones, and risks. And of course you have to inspire confidence, set expectations, and quickly show how we’re progressing… all within one slide. #nopressure
I’ve had a lot of success with a simple table that identifies:
- the goal for each tactic – we rarely give execs this context and explain what time-consuming (and jargony!) projects will accomplish
- when we expect tactics to be completed
- how complex vs. important each tactic is
- what’s active and what’s completed
You can click the images to expand them.
Here’s another version that also shows how each tactic affects the funnel. #lovetoseeit
![]()
2. Evolving rates
Marketing often presents funnel conversion rates as a snapshot in time (because to be honest we’re screenshot-ing data from Salesforce). But that doesn’t tell the more interesting story of how thing are trending. Instead, a simple table shows how data compares quarter-to-quarter, with dead simple color coding that highlights good growth or worrying regressions.
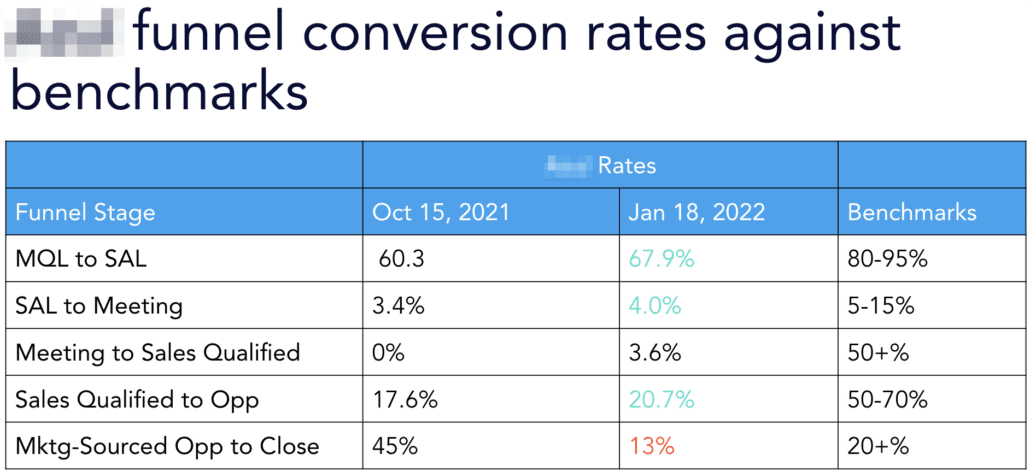
When possible, include industry benchmarks for these rates… not many execs know a 6% SAL-to-Meeting rate is good.
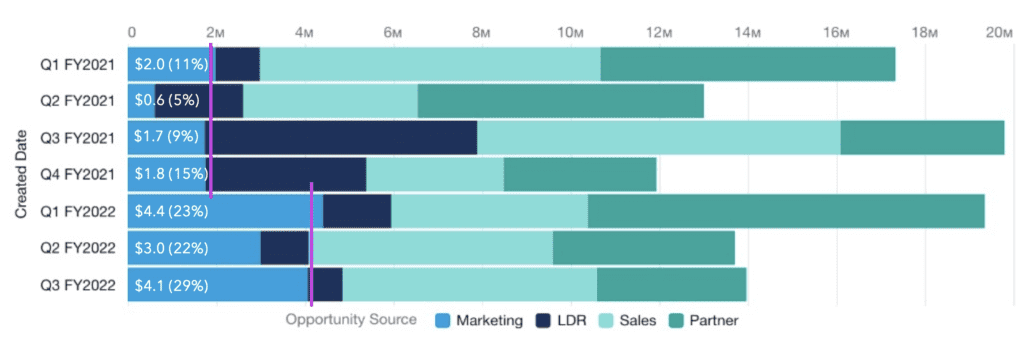
3. Attribution
Attribution is such a touchy/territorial subject for the Marketing, Sales, and LDR teams. But honestly? Boards aren’t interesting in squabbling over who has a bigger slice of the literal pie chart. Instead, show trends over time. This stacked bar graph tracks overall revenue every quarter (which is all the board cares about at the end of the day).
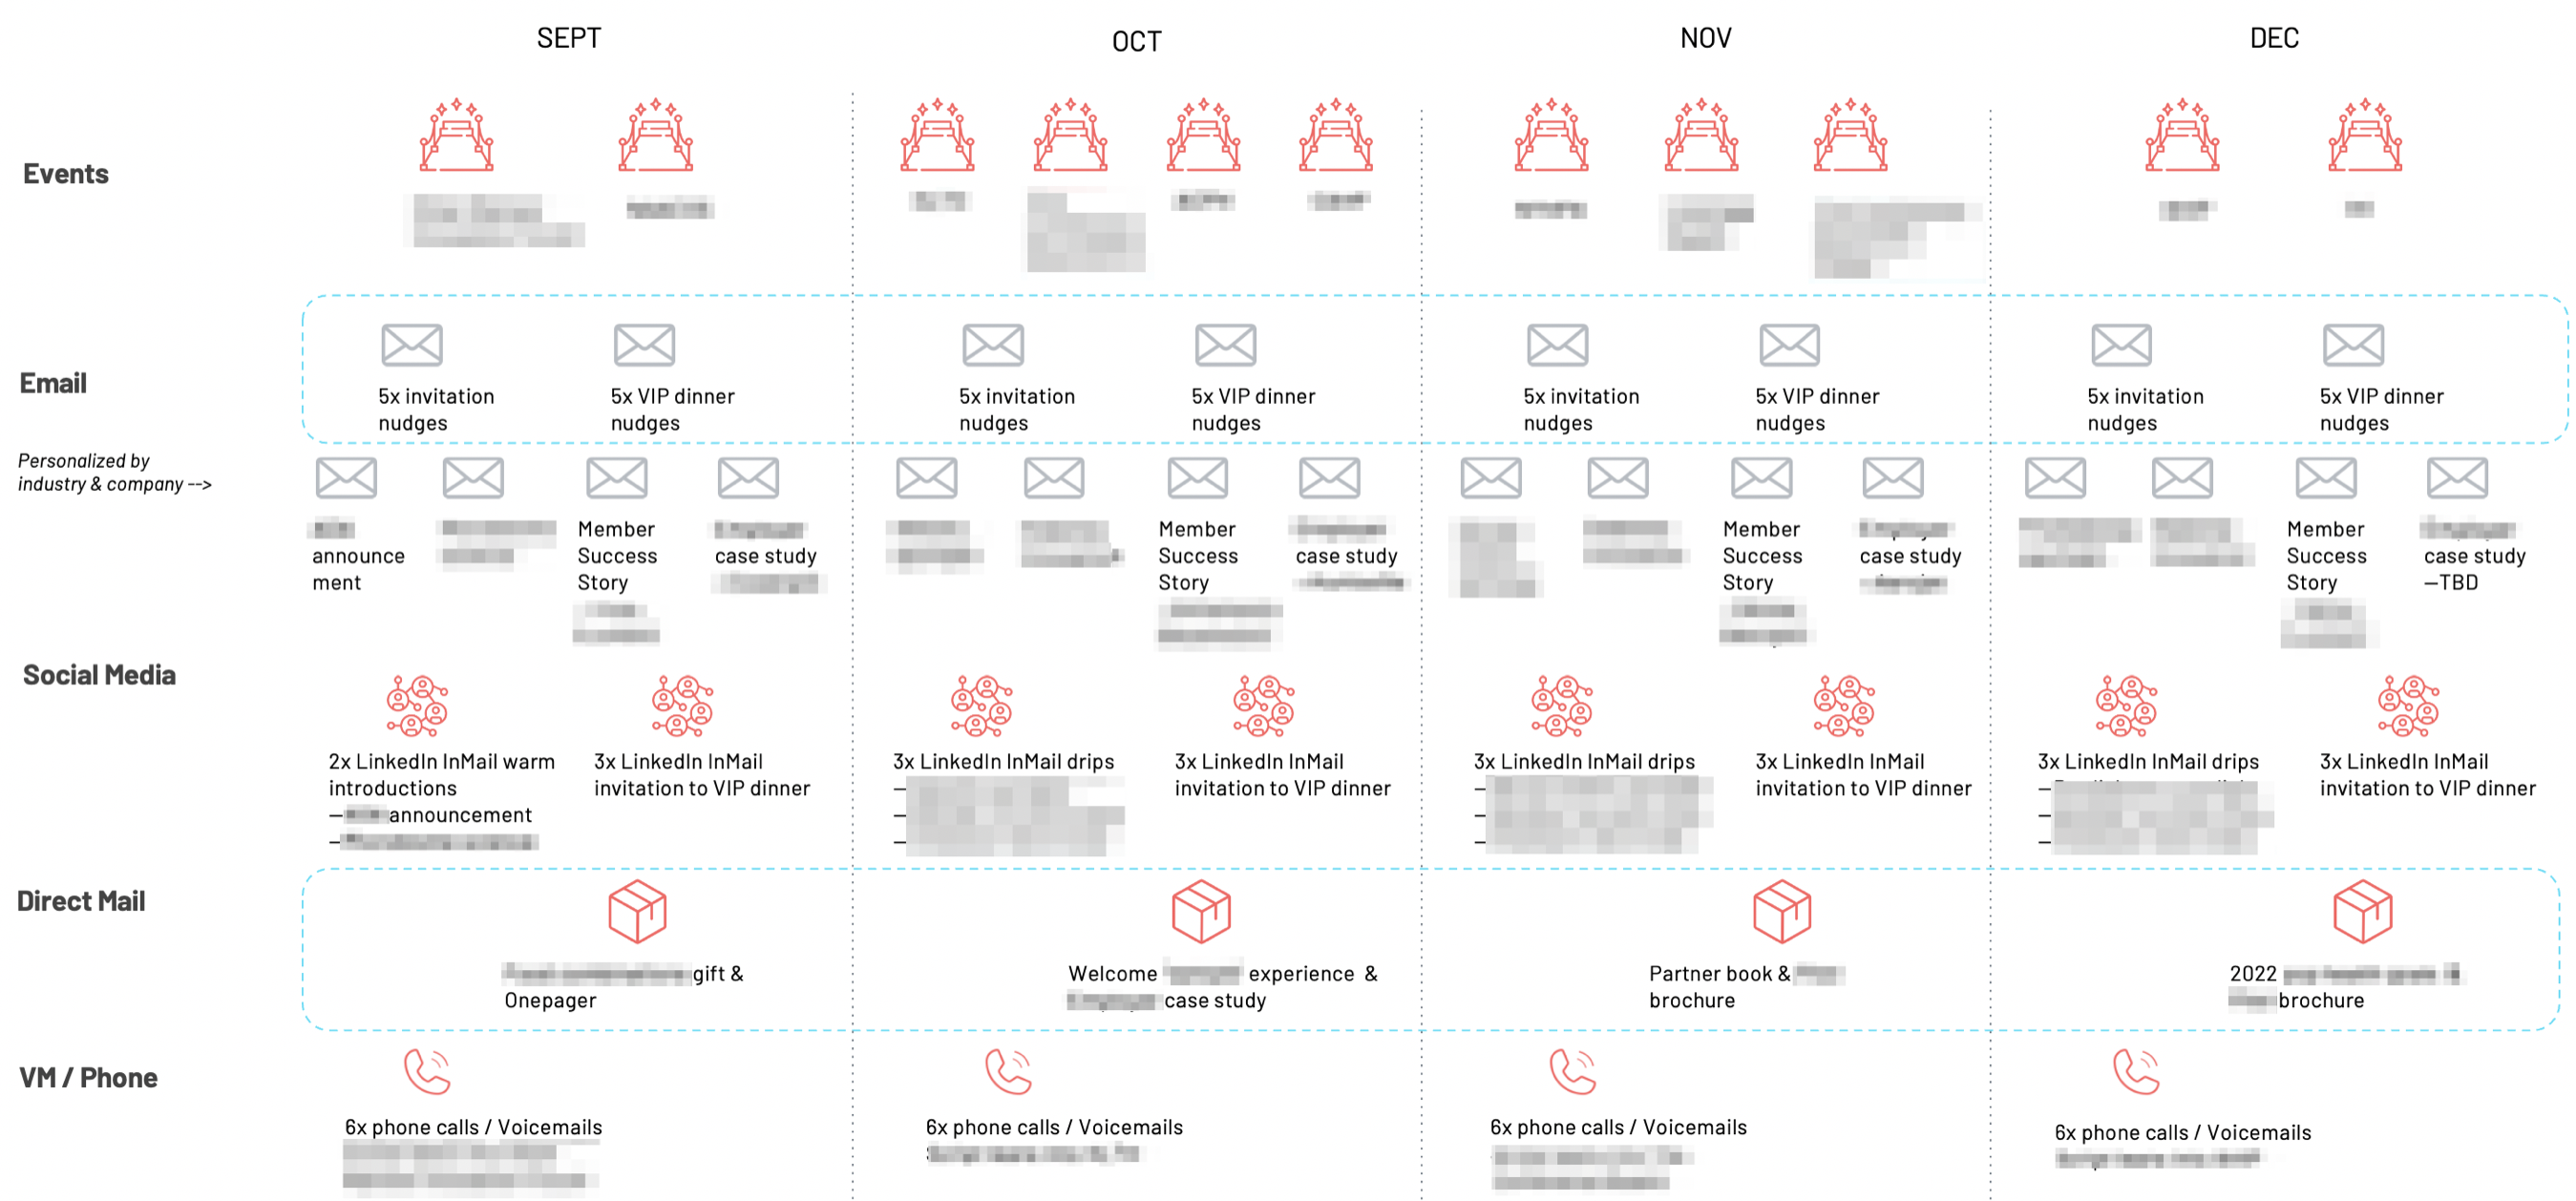
4. Visualize omnichannel campaigns
It’s rare that Marketing gets to present campaign ideas. If you’re so lucky, be sure to show both your strategy brief, and an impressive summary of all the touch points. This campaign template does a great job visualizing a regular cadence across channels.
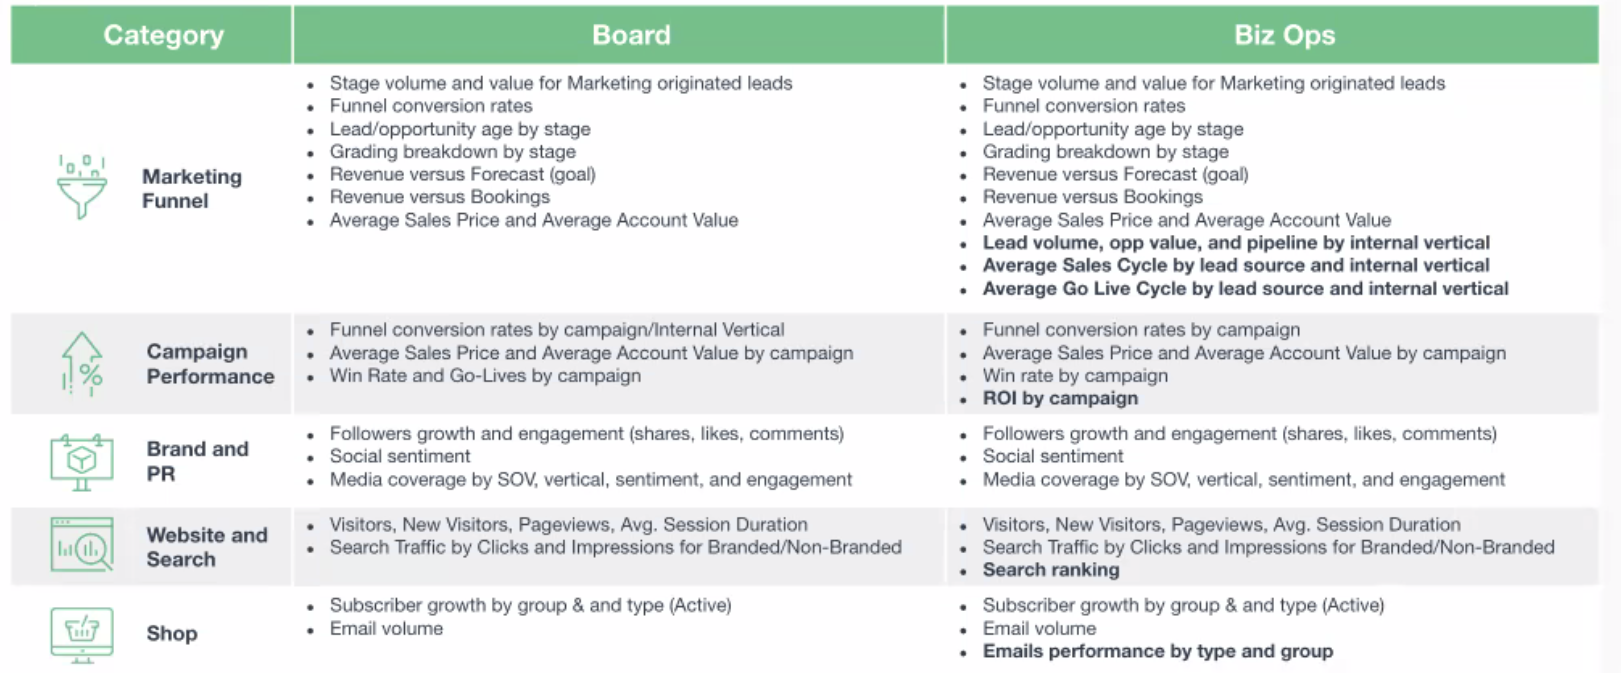
5. And remember, less is more
Modern martech means there are a ton of ways to track success, but they’re rarely interesting beyond the Marketing team. Ruthlessly edit which KPIs you elevate to the board deck. In this example, the team even had a formal definition of what KPIs they track internally vs. what they present to the board: