We’re pretty diehard about optimizing lead follow-up: even a minuscule improvement can have a monumental impact on pipeline. I recently audited a client’s lead management process and found that improving the BDR-to-AE handoff by just 5% would generate an additional $549,477 in their annualized bookings – without any additional spend to fill the top of the funnel. 🤯 (And we’ve helped a client improve that handoff by 50%!)
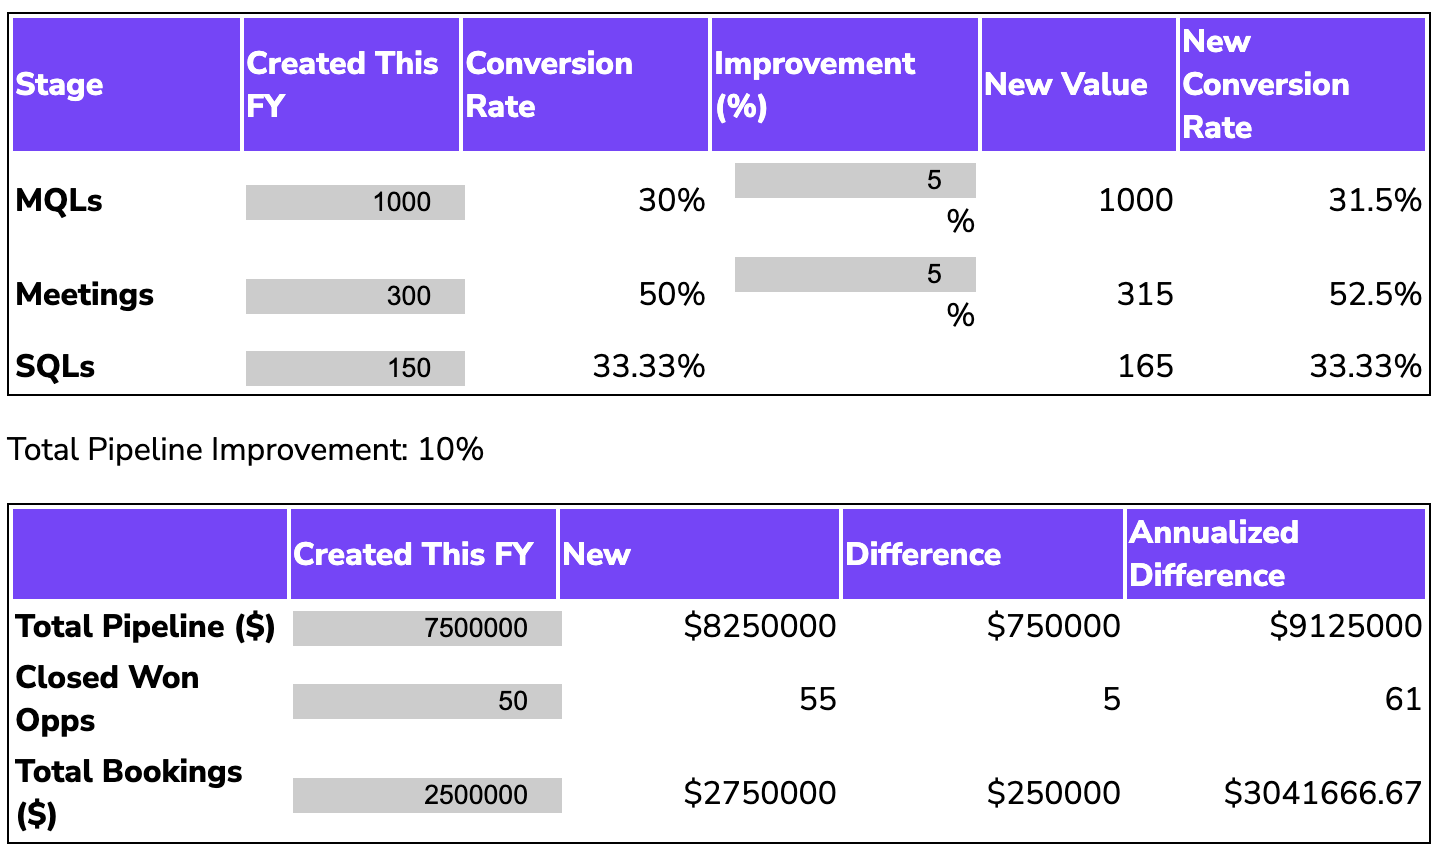
I ended up creating a lil Sales Funnel ROI Calculator to help you tinker with your own conversion rates and model the impact.
>> Related: How to Measure Lead Follow-Up Beyond First Touch <<
How to use the Sales Funnel ROI calculator:
- Simply enter the date that your fiscal year started.
- Fill in the inputs for MQLs, Meetings, SQLs, Total Pipeline, Closed Won Opps, and Total Bookings for this Fiscal Year. Note: the default values use a standard calendar year, a 30% MQL to Meeting rate, 50% Meeting to SQL rate with an ASP of $50,000 and a Win Rate of 33%.
- The calculator will then figure out your baseline conversion rates.
- You can then play around with the Improvement % columns to see how improving the Marketing > BDR (default 5% improvement) and BDR > AE handoffs (default 5% improvement) would affect your pipeline.
It will calculate:
- What your “new” values would be at this point in the year
- The difference between your current actual values
- An annualized difference based on current progress through your fiscal year
Chances are the ROI of even a modest improvement will outstrip the slickest MarTech or most viral marketing campaign. Have fun!
See the Pen
ROI Calculator by Todd (@Sponge_)
on CodePen.
A couple notes:
- It reacts to when the start of your fiscal year is.
- If you don’t know your existing conversion rates, you can reference our funnel benchmarks.
More in the lead follow-up series:
- Benchmarks for B2B Funnel Conversion Rates
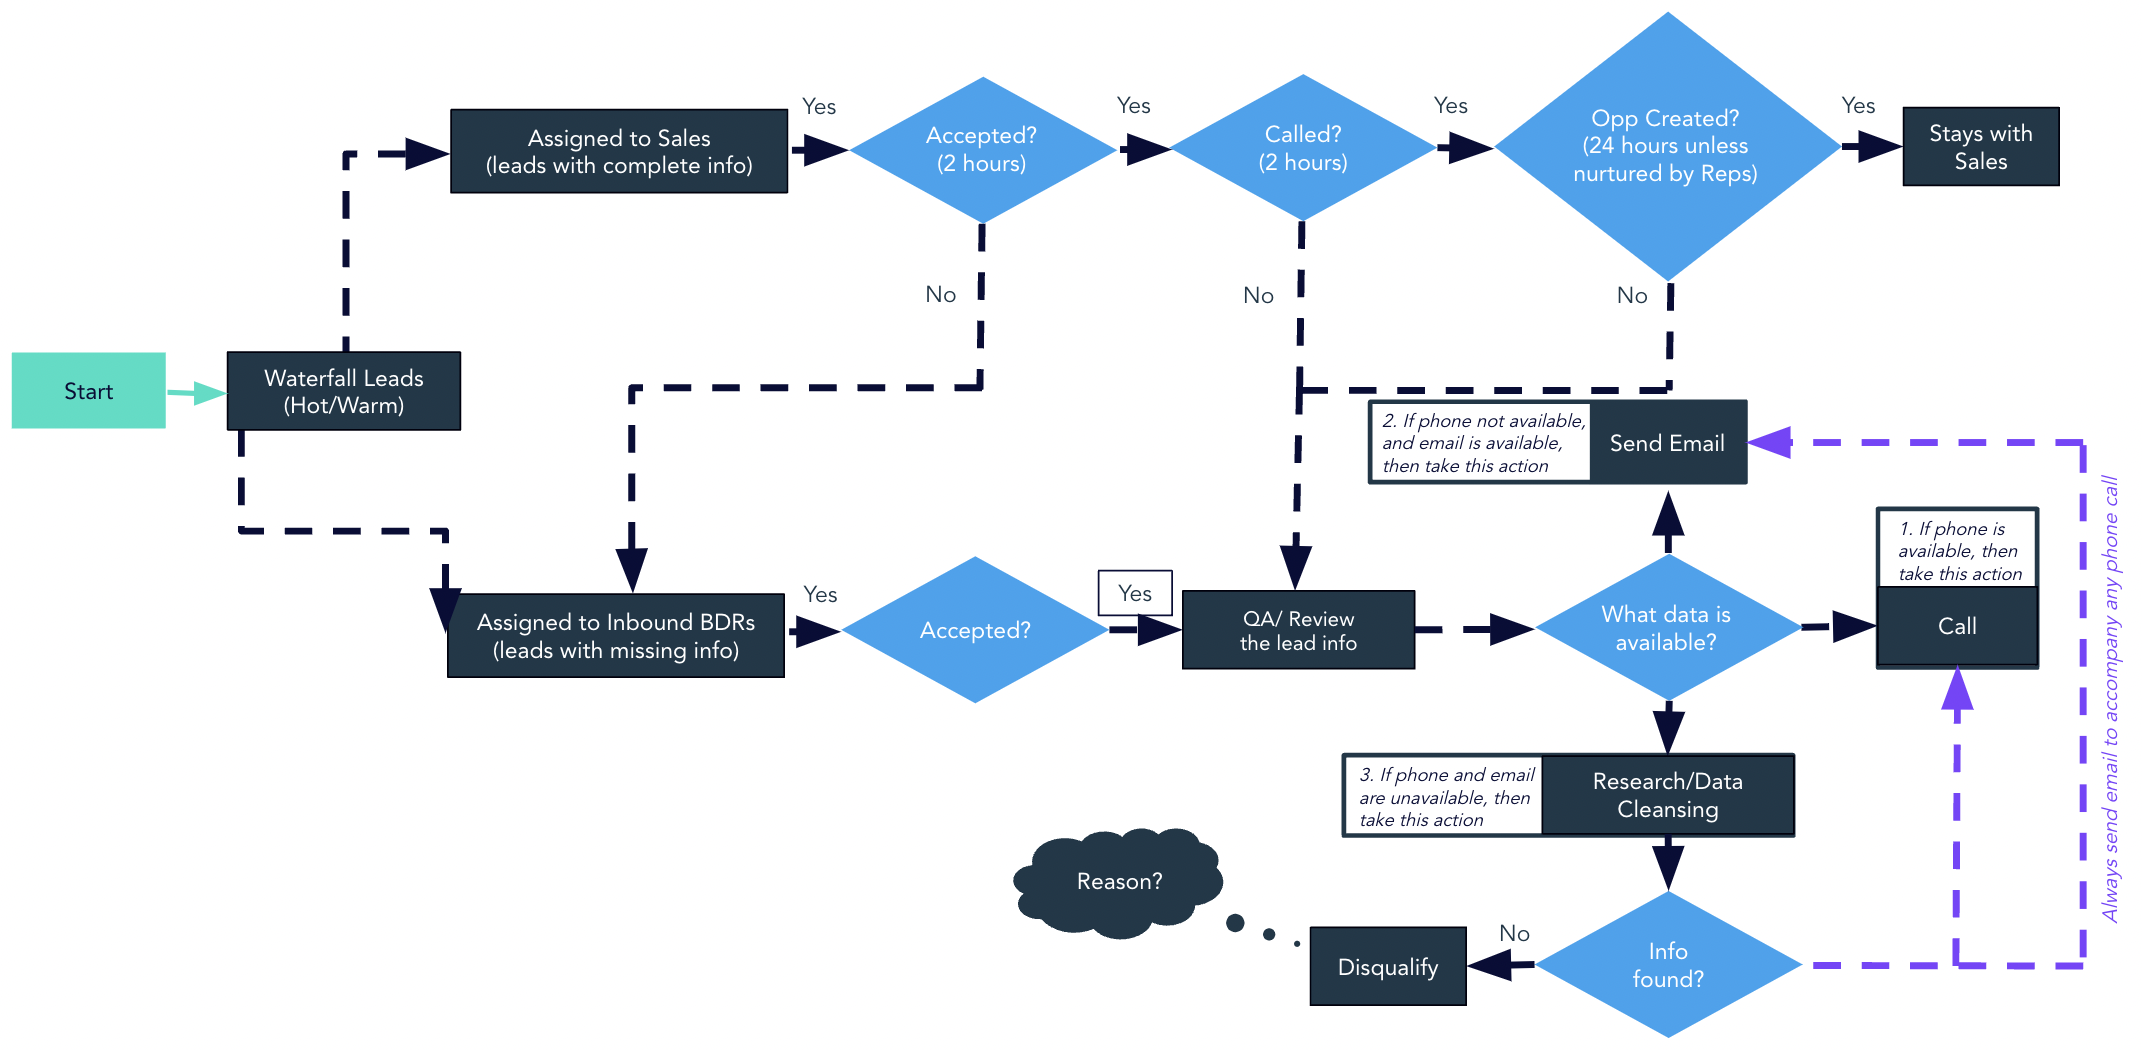
- 8 Lead Management Process Samples
- How to Build an MQL SLA Alert in Salesforce
- How to Measure Lead Follow-Up Beyond First Touch


